
Current Situation
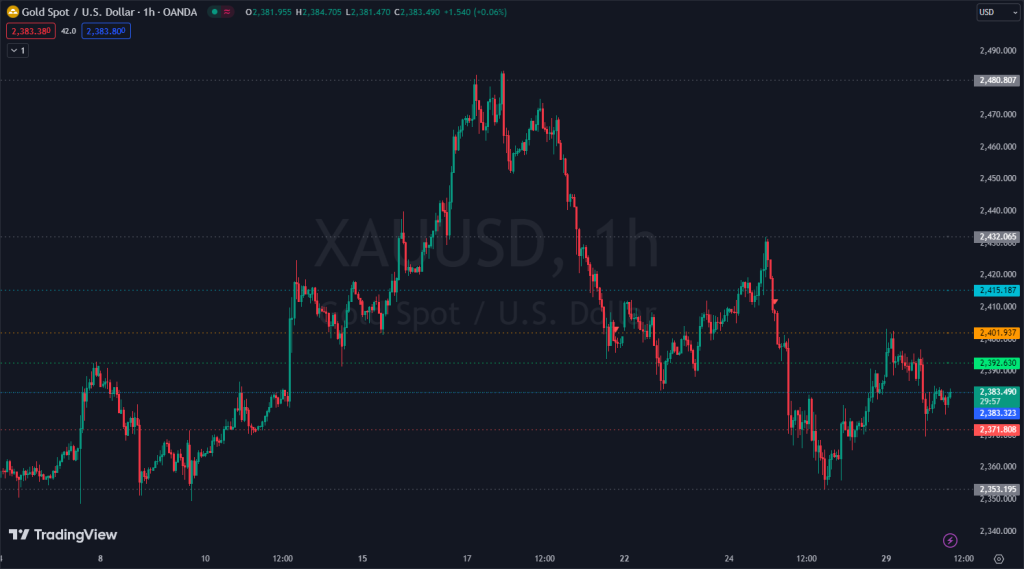
Recently, gold prices have experienced significant volatility. On the 1-hour chart of XAU/USD, we can observe clear cycles of uptrends and downtrends, creating a challenging yet fascinating picture for investors and traders. Currently, gold is trading around $2,383.323, hovering between critical support and resistance levels.
Support and Resistance Levels
To gain a comprehensive view of the market, the first step is to identify the support and resistance levels. These are points where the price is likely to react strongly, helping us predict future trends.
Resistance:
$2,480.807: This is the highest resistance level on the chart. Historically, the price has failed to break above this level and has dropped significantly after touching it.
$2,432.065: Another critical resistance level where the price has faced rejection and dropped sharply.
$2,415.187: An intermediate resistance level where the price has reacted and turned downwards.
$2,401.937: A nearer resistance level to the current price. The price has struggled to break above this level and has declined afterward.
Support:
$2,371.808: The nearest support level. If the price drops and breaks below this level, it could continue to fall further.
$2,353.195: A lower support level where the price might find support if the above support level is broken.
Current Trend
With the current price at $2,383.323, gold is situated between support and resistance levels, indicating market indecision about the next direction. The 1-hour chart provides a short-term view, but it is sufficient to identify crucial points to watch.
Short-Term Forecast
Bullish Scenario:
If the price breaks above the nearest resistance level of $2,401.937 and sustains above this level, it could test higher resistance levels like $2,415.187 and $2,432.065.
Positive economic news or a weaker USD could help push the price higher.
Bearish Scenario:
If the price fails to break above $2,401.937 and starts to decline, it could test the nearest support level of $2,371.808.
If this support level is broken, the price could continue to fall to $2,353.195.
General Recommendations
Monitor Economic Indicators: Events such as announcements from the Federal Reserve, employment reports, and inflation data can significantly impact gold prices. These news events often create substantial volatility and can change the market trend in the short term.
Use Stop-Loss Orders: Place stop-loss orders to manage risk in case the market moves against your prediction. This helps protect your trading account from unwanted losses.
Combine Technical and Fundamental Analysis: Use both methods to have a comprehensive view of the market. Technical analysis helps identify trends and key price levels, while fundamental analysis provides insights into economic factors and news that could affect gold prices.